🔍 Overview: BTC/USD Outlook at a Turning Point
| Parameter | Value |
|---|---|
| Trading Instrument | BTC/USD (Bitcoin) |
| Date | April 21, 2025 |
| Chart Momentum | ⚖️ Neutral |
| Potential Direction | 📈 Bullish |
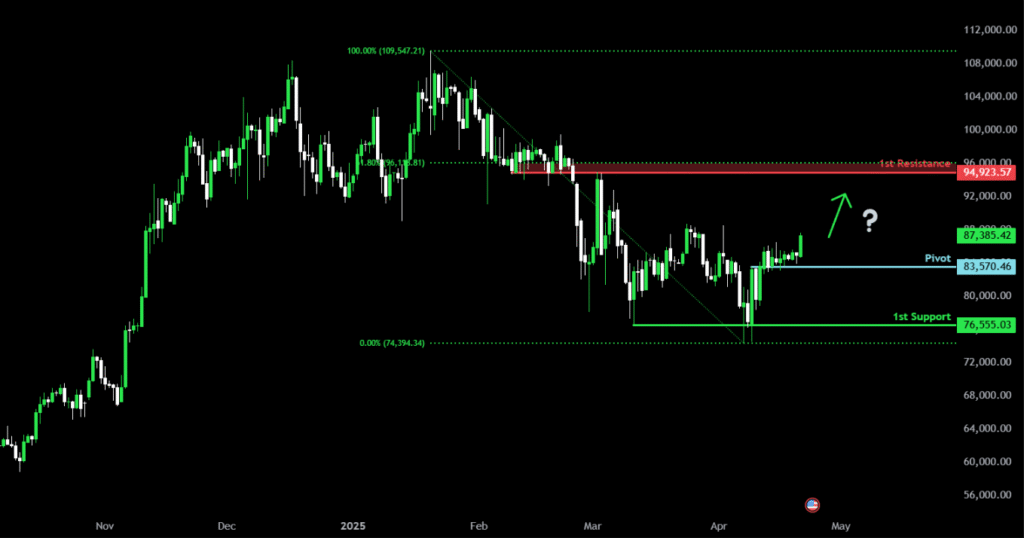
📈 Key Levels: Bitcoin Bulls Eyeing 94,923.57
| Level | Price | Description |
|---|---|---|
| Pivot Support | 83,570.46 | Overlap support zone where Bitcoin just bounced; a critical base level |
| 1st Support | 76,555.03 | Multi-swing low zone, historically reliable area for price stabilization |
| 1st Resistance | 94,923.57 | Overlap resistance + 61.8% Fibonacci retracement – major area of potential stall |
🧠 Market Sentiment: Bulls Step In at Pivot Level
Bitcoin has recently bounced off the overlap support near 83,570, suggesting buyers are re-entering the market with moderate confidence. While overall momentum is neutral, this bounce sets the stage for a bullish move toward the $94,900 resistance zone, which aligns with a 61.8% Fibonacci retracement from the recent downward swing.
📊 Technical Indicators & Signals
🔧 Indicators In Use
- Fibonacci Retracement (61.8%)
- Resistance at 94,923.57 aligns closely with this retracement – often considered the “golden ratio” for reversals.
- Parabolic SAR
- SAR dots currently below the price on the 4H and daily chart – signaling a bullish trend continuation.
- RSI (14)
- Currently around 55–60 zone, suggesting room for upward movement before hitting overbought (70+)
- MACD (12,26,9)
- Histogram has flipped bullish, and MACD line is crossing above the signal line – upward momentum gaining.
- Stochastic Oscillator
- Currently pointing upward, with both lines crossing over from mid-zone – another bullish confirmation.
🟢 Pivot Zone – 83,570.46
- This zone acts as an overlap support — a key technical level formed by intersecting prior lows and highs.
- Confluence with recent consolidation adds further validation as a springboard for bullish moves.
- A bounce from here with MACD and SAR support boosts confidence in long positions.
🔻 First Support – 76,555.03
- A multi-swing low zone tested multiple times in the past — it acts as a reliable demand area.
- In case of rejection from current levels, price may retest this zone to gather more buyers.
- Ideal stop-loss zone if entering long near current levels.
🔺 First Resistance – 94,923.57
- Strong overlap resistance from the 4H and daily charts.
- Aligns with 61.8% Fibonacci retracement from the swing high of ~$115,000 to recent lows — classic profit zone.
- Potential reversal or profit-taking area for swing traders and institutions.
🎯 BTC/USD Trade Strategy (April 21, 2025)
| Element | Strategy |
|---|---|
| Trade Bias | Long (bullish) |
| Entry Zone | Anywhere between 83,800–85,200 (confirmation via candle structure or SAR support) |
| Stop-Loss | Below 76,555 (key support zone) |
| Take Profit 1 | 91,000 – mid-level structure zone |
| Take Profit 2 | 94,923.57 – key resistance/fib confluence |
| Risk-Reward | Minimum 1:2 preferred; higher on breakout entries |
🧭 Fundamental Outlook for Bitcoin
- Macroeconomic Risk Appetite
- Markets are showing resilience amid rate pauses, pushing capital into high-risk assets like BTC.
- ETF & Institutional Flow Watch
- Recent inflows into BTC spot ETFs suggest strong undercurrent demand.
- Halving Cycle Psychology
- The 2024 halving continues to influence bullish narratives – long-term investors looking to buy dips.
- On-Chain Metrics
- Active addresses rising, miner selling pressure decreasing – both historically bullish.
🔔 Upcoming Events to Watch
| Date | Event | Potential Impact |
|---|---|---|
| Apr 23 | Fed Governor Speech | Medium |
| Apr 24 | US Initial Jobless Claims | Medium |
| Apr 26 | US Core PCE (Fed’s key inflation gauge) | High |
| May 1 | FOMC Rate Decision | Very High |
| Ongoing | Bitcoin ETF Net Inflows Data | High |
📊 These events could create volatility spikes. Watch for fake breakouts or volume-confirmed moves near key levels.
🧾 Conclusion: Bitcoin Bulls Target $94,923.57 as Technicals Align
Bitcoin is attempting a bullish move off the 83,570 support, with major technical and psychological factors supporting further upside. The MACD crossover, SAR flip, and Fibonacci confluence near resistance make this a technically rich setup.
As long as 76,555 holds, BTC/USD is in play for a rally toward 94,923, potentially paving the way for a broader continuation if bullish sentiment sustains.