DXY (US Dollar Index) Technical Analysis: Bullish Setup in Bearish Momentum – Will the Pivot Trigger a Reversal?
Meta Description (SEO):
Is the US Dollar Index (DXY) set for a bullish rebound? Discover key technical levels, SAR indicators, Fibonacci zones, and macroeconomic factors driving DXY. Trade smarter with this in-depth USD Index forecast.
Keyphrases to Rank For:
- DXY technical analysis
- US Dollar Index forecast today
- DXY support and resistance
- DXY trading strategy
- Fibonacci levels DXY
- Is DXY bullish or bearish
- US Dollar Index pivot level
- Forex DXY outlook
🔍 Overview of DXY (US Dollar Index)
Trading Instrument: DXY (US Dollar Index)
Timeframe Analyzed: 4H and Daily Charts
Potential Direction: 📈 Bullish Reversal Expected
Current Chart Momentum: 📉 Short-term Bearish
⚙️ Technical Analysis Summary
| Level | Price | Analysis |
|---|---|---|
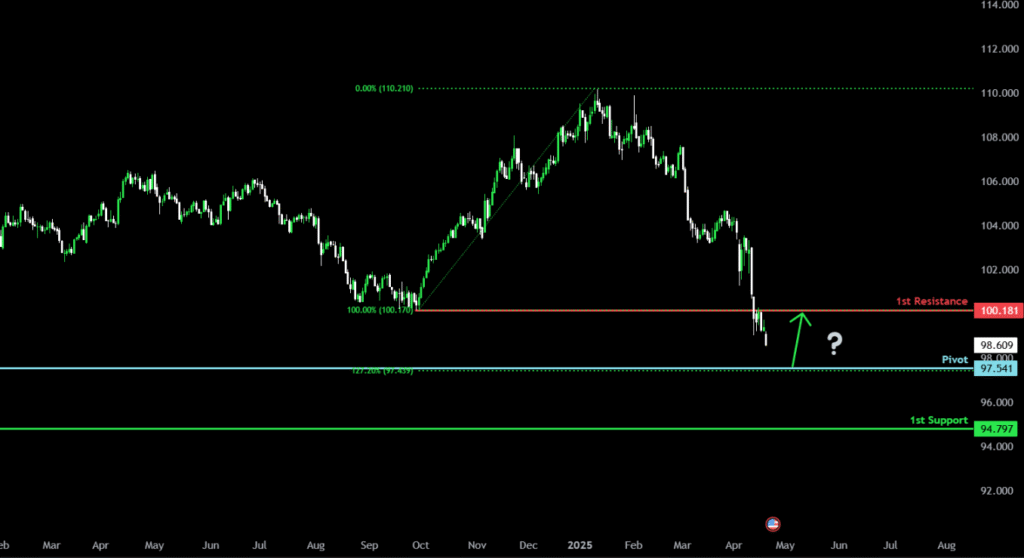
| Pivot Point | 97.54 | Crucial confluence zone with 127.2% Fibonacci extension—ideal bounce level |
| 1st Support | 94.79 | Historical swing low—potential demand zone |
| 1st Resistance | 100.18 | Key pullback resistance—profit-taking zone for bulls |
📉 Bearish Momentum: A Temporary Dip Before the Climb?
Despite the short-term bearish momentum, the DXY is approaching a crucial technical pivot at 97.54, which aligns with the 127.2% Fibonacci extension from the previous upward swing. This level could act as a launchpad for a bullish rebound if buying pressure re-enters the market.
🔧 Technical Indicators Used
- Fibonacci Extension (127.2%): Marks pivot level at 97.54, a typical reversal zone in trend pullbacks.
- Stochastic Oscillator: Currently in oversold territory on the 4H chart, suggesting bullish divergence may develop.
- RSI (14): DXY RSI is hovering near 40, close to the reversal threshold—indicating bearish momentum may be weakening.
- MACD: Histogram bars are contracting, hinting at a potential bullish crossover.
- Parabolic SAR: Current SAR dots are above price, confirming bearish trend continuation—but watch for a flip near the pivot.
- 200 EMA & 50 EMA: Price trading below 200 EMA but may reclaim 50 EMA post-pivot bounce.
📊 Support & Resistance Levels Breakdown
🔻 1st Support – 94.79
- Technical Insight: This level aligns with a previous swing low and historical reaction zone.
- Buyers’ Radar: A stronghold for bullish entry if pivot fails.
🔼 Pivot Level – 97.54
- Why It Matters:
- 127.2% Fibonacci extension of recent swing.
- Former demand zone and mid-structure level.
- Psychological level that has held as support in prior market cycles.
- Strategy Tip: Watch for bullish candlestick formations like hammer or bullish engulfing at this level before entering long.
🔺 1st Resistance – 100.18
- Profit-Taking Target:
- Strong pullback resistance zone.
- 61.8% Fibonacci retracement from last peak to recent low.
- Prior rejection zone with historically high selling volume.
🧠 Trading Strategy & Execution Plan
- Wait for Price to Approach 97.54
- Look for bullish reversal candlestick patterns.
- Confirm RSI divergence and MACD histogram contraction.
- Entry Trigger (Buy)
- On a bullish engulfing candle or pin bar with SAR flip confirmation.
- Place stop-loss just below 94.79 support.
- Target 1: 99.20 (near-term resistance)
- Target 2: 100.18 (main resistance)
- Risk Management: Use 1:2 or 1:3 risk/reward ratio for optimal trade setups.
🧭 Fundamental Backdrop Supporting DXY Reversal
- Interest Rate Expectations: Hawkish sentiment from the Federal Reserve remains supportive of the dollar’s strength. Any dovish surprises, however, could weaken this narrative.
- Inflation Data: Watch upcoming US CPI/PCE releases. Hotter-than-expected prints may support USD strength.
- Geopolitical Risk: Continued global tensions (e.g., in the Middle East or Asia) may lead to safe-haven demand for the USD.
- Yield Curve: If long-term yields rise further, USD strength is likely to follow due to capital inflows.
🔔 Upcoming Economic Events to Watch
| Date | Event | Expected Impact on DXY |
|---|---|---|
| Apr 24 | US Durable Goods Orders | Medium |
| Apr 26 | PCE Price Index (Fed’s favorite) | High |
| May 1 | FOMC Rate Decision | Very High |
| May 3 | US Non-Farm Payrolls (NFP) | Very High |
These events could dramatically affect DXY volatility—watch them closely for breakout or rejection confirmations.
📌 Conclusion: DXY at a Decisive Turning Point
The DXY is in a classic technical scenario where bearish momentum is approaching a bullish pivot zone. If the index finds support at 97.54 and shows reversal signs, it could rally toward the 100.18 resistance level. However, traders must remain cautious of macroeconomic data and potential SAR trend confirmations before taking action.
📈 Trade idea: Consider a buy limit near 97.54, targeting a short-term move to 99.20 and 100.18, while maintaining a stop loss below 94.79.