🔍 Overview of EUR/USD Setup
| Parameter | Value |
|---|---|
| Trading Instrument | EUR/USD |
| Date | April 21, 2025 |
| Chart Momentum | 📈 Bullish (short-term) |
| Potential Direction | 📉 Bearish Reversal |
⚙️ Summary of Key Levels
| Level | Price | Explanation |
|---|---|---|
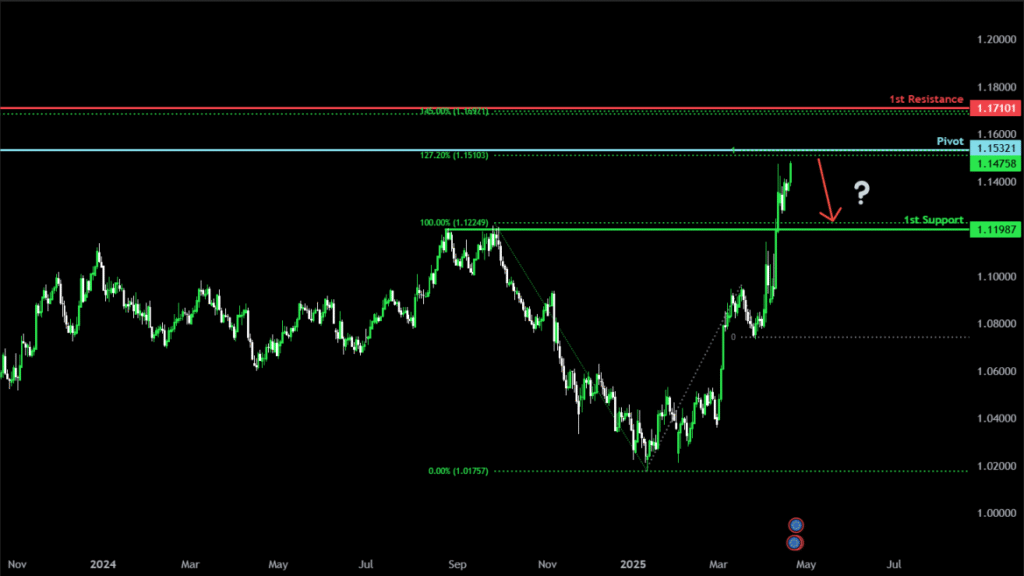
| Pivot Point | 1.1532 | Strong confluence of 100% Fibonacci projection and 127.2% extension – key reversal zone |
| 1st Support | 1.1198 | Pullback support where buyers may attempt stabilization |
| 1st Resistance | 1.1710 | Strong pullback resistance – potential cap to further bullish momentum |
🧠 Market Narrative: Bearish Setup Forming on a Bullish Chart
Despite the short-term bullish trend, the EUR/USD pair is showing signs of bearish exhaustion as it approaches the 1.1532 pivot zone. This level aligns with Fibonacci confluences and is reinforced by waning bullish indicators — signaling the potential for a trend reversal.
This makes it an ideal zone for short sellers to monitor for confirmation patterns.
📈 Technical Indicators & Tools in Play
- Fibonacci Projection & Extension
- 100% projection from previous swing = 1.1532
- 127.2% Fibonacci extension = 1.1532
➤ Strong resistance confluence zone; ideal for bearish entries
- Relative Strength Index (RSI 14)
- RSI currently around 68 on the 4H chart – nearing overbought territory
- MACD (12,26,9)
- Histogram shows fading momentum; potential for crossover below signal line
- Parabolic SAR
- SAR dots still below price – bullish trend active
- Watch for SAR flip above price near pivot for short confirmation
- Stochastic Oscillator
- Overbought > 80; signaling weakening bullish control
- 50 EMA and 200 EMA
- Price trading above both EMAs, but showing divergence slowdown
🔽 Key Technical Levels Explained
🔹 Pivot Zone – 1.1532
- 💡 Bearish Reversal Setup
- 100% Fibonacci projection of the prior bullish leg
- 127.2% extension = exhaustion zone for bulls
- Resistance cluster may trigger institutional selling
- Best Strategy: Wait for a bearish engulfing or shooting star candle at this zone
🔻 Support – 1.1198
- Key pullback support from prior bullish structure
- Buyers may defend this level if price drops post-pivot rejection
- Ideal Take Profit zone for short trades entered near the pivot
🔼 Resistance – 1.1710
- A higher timeframe resistance from 1D chart
- If 1.1532 breaks, price may retest this level before forming the next top
- Confluence with 161.8% Fibonacci extension
🧩 Trading Strategy for EUR/USD – April 2025
| Element | Description |
|---|---|
| Entry Idea | Sell near 1.1532 (with confirmation of rejection candle or SAR flip) |
| Stop Loss | Just above 1.1560 (above rejection wick or SAR dots) |
| Take Profit 1 | 1.1320 – conservative TP at midpoint of support zone |
| Take Profit 2 | 1.1198 – key structural support and main TP target |
| Risk-Reward | Minimum 1:2 ratio recommended |
🧪 Confirmation Checklist Before Entering Short:
- RSI overbought (>70)? ✅
- MACD crossover forming? ✅
- Bearish candlestick at pivot? ✅
- SAR flip happening near 1.1532? ✅
🌐 Fundamental Factors Influencing EUR/USD
- Federal Reserve Policy
- DXY strength may reassert if Fed signals continued tightening
- Higher US Treasury yields attract capital → USD strength → EUR/USD bearish
- ECB Policy Outlook
- If ECB remains dovish on rates, downside pressure on EUR increases
- Geopolitical Concerns in EU
- Risk-off sentiment often favors the USD
- Upcoming Economic Data
- US GDP and Core PCE Index (April 26, 2025)
- Eurozone inflation and ZEW economic sentiment (April 23-25, 2025)
🧭 Watch These Upcoming Events
| Date | Event | Expected Impact |
|---|---|---|
| Apr 23 | Eurozone Flash PMIs | Medium |
| Apr 24 | US Initial Jobless Claims | Medium |
| Apr 25 | German IFO Business Climate | High |
| Apr 26 | US Core PCE Inflation Data | Very High |
| May 1 | ECB Rate Statement | Very High |
⚠️ Volatility Warning: Events could trigger breakout or fakeout near pivot – manage trades accordingly.
📌 Conclusion: Watch 1.1532 – The Battle of Bulls and Bears
EUR/USD is trading in a bullish short-term structure, but macro and technical indicators suggest exhaustion near 1.1532. This zone presents a high-probability reversal setup, especially if confluence aligns with SAR flip, RSI overbought, and MACD crossover.
A clean rejection from this level could lead to a drop toward 1.1198, making this an attractive opportunity for disciplined short trades.